One of the easiest ways to increase your home value and your quality of life is by tackling a home improvement project.
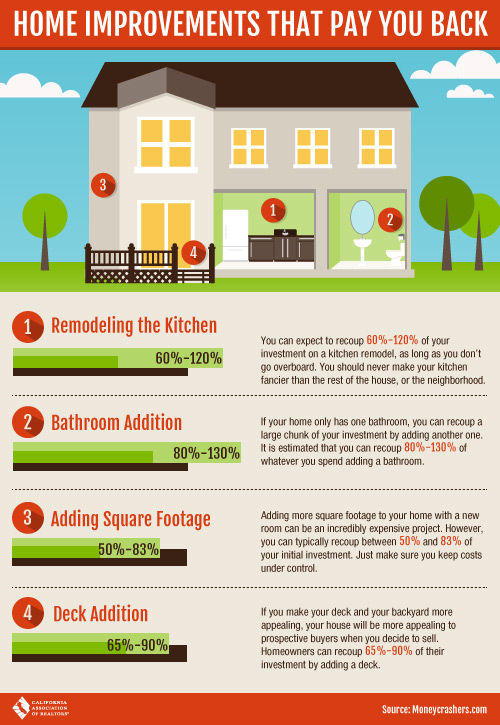
Home Improvements that pay you back!
February 13, 2014 by
Southland Home Sales Drop in January – Price Picture Mixed
February 13, 2014 by
Source: DQNews.com
February 12, 2014
La Jolla, CA—Southern California logged its lowest January home sales in three years as buyers continued to wrestle with a tight inventory of homes for sale, a fussy mortgage market and the highest prices in years. The median price paid for a home dipped from December – a normal seasonal decline – but remained 18 percent higher than January last year, a real estate information service reported.
A total of 14,471 new and resale houses and condos sold in Los Angeles, Riverside, San Diego, Ventura, San Bernardino and Orange counties last month. That was down 21.4 percent from 18,415 in December, and down 9.9 percent from 16,058 sales in January 2013, according to San Diego-based DataQuick.
A significant drop in sales between December and January is to be expected because many buyers drop out of the market during the holidays and mid-winter. That means fewer transactions close during January and February. On average, sales have declined 27.6 percent between December and January since 1988, when DataQuick’s statistics begin.
Last month’s Southland sales were 17.3 percent below the average number of sales – 17,493 – in the month of January since 1988. Sales haven’t been above average for any particular month in more than seven years. January sales have ranged from a low of 9,983 in January 2008 to a high of 26,083 in January 2004.
“The economy is growing, but Southland home sales have fallen on a year-over-year basis for four consecutive months now and remain well below average. Why? We’re still putting a lot of the blame on the low inventory. But mortgage availability, the rise in interest rates and higher home prices matter, too,” said John Walsh, DataQuick president.
“Two of the bigger questions hanging over the housing market right now are,‘How much pent-up demand is left out there?’ and, ‘Will inventory skyrocket this year as more owners take advantage of the price run-up?’” Walsh continued. “Unfortunately, we’ll probably have to wait until spring for the answers. When it comes to statistical trends, January and February are atypical months that haven’t proven to be predictive over the years.”
The median price paid for all new and resale houses and condos sold in the six-county region last month was $380,000, down 3.8 percent from $395,000 in December and up 18.4 percent from $321,000 in January 2013. Because of seasonal changes it is typical for the median to decline between December and January, with that drop averaging 2.9 percent since 1988. Last month’s median was the lowest since it was $368,000 in May last year.
The Southland’s median price held at or near $385,000 between last June and November, then rose to $395,000 in December, which was the peak for 2013 and the highest for any month since February 2008, when it was $408,000.
The median sale price has risen on a year-over-year basis for 22 consecutive months. Those gains have been double-digit – between 10.8 percent and 28.3 percent – over the past 18 months. The January median stood 24.8 percent below the peak $505,000 median in spring/summer 2007.
Prices have been rising at different rates depending on price segment. In January, the lowest-cost third of the region’s housing stock saw a 23.3 percent year-over-year increase in the median price paid per square foot for resale houses. The annual gain was 20.3 percent for the middle third of the market and 19.7 percent for the top, most-expensive third.
The number of homes sold in many middle and up-market areas continued to rise on a year-over-year basis last month, while more affordable markets generally saw less activity than a year earlier.
Last month sales from $300,000 through $799,999 – a range that includes many move-up buyers – rose 4.7 percent year-over-year. The number that sold for $500,000 or more increased 26.3 percent from one year earlier, while $800,000-plus sales rose 36.7 percent.
In January, 32.0 percent of all Southland home sales were for $500,000 or more, down from a revised 35.0 percent the month before and up from 22.2 percent a year earlier.
The number of Southland homes that sold below $200,000 last month dropped 46.8 percent year-over-year, while sales below $300,000 fell 37.1 percent. One of the main reasons for the big decline in lower-end sales is the relatively low supply of homes on the market. Many owners still can’t afford to sell their homes because they owe more than they are worth, and lenders aren’t foreclosing on as many properties, further limiting supply.
Foreclosure resales – homes foreclosed on in the prior 12 months – accounted for 6.6 percent of the Southland resale market in January. That was up slightly from 5.8 percent the prior month and was down from 17.2 percent a year earlier. In recent months the foreclosure resale rate has been the lowest since early 2007. In the current cycle, foreclosure resales hit a high of 56.7 percent in February 2009.
Short sales – transactions where the sale price fell short of what was owed on the property – made up an estimated 12.2 percent of Southland resales last month. That was down from 13.1 percent the prior month and down from 24.2 percent a year earlier.
Absentee buyers – mostly investors and some second-home purchasers – bought 27.5 percent of the Southland homes sold last month, up slightly from 27.2 percent in December and down from a record 32.4 percent a year earlier. The monthly average since 2000, when the absentee data begin, is 18.6 percent. Last month’s absentee buyers paid a median $325,000, down 1.5 percent from the month before and up 31.6 percent year-over-year.
In January 6.3 percent of all Southland homes sold on the open market were flipped, meaning they had previously sold in the prior six months. That’s up from a flipping rate of 5.8 percent the month before and down from 6.6 percent a year earlier. Flipping peaked at 7.0 percent in February 2013. (The figures exclude homes resold after being purchased at public foreclosure auctions on the courthouse steps).
Buyers paying cash last month accounted for 29.1 percent of home sales, up from 28.7 percent the month before and down from 33.7 percent a year earlier. The cash share of purchases hit an all-time peak of 36.9 percent in February 2013. Since 1988 the monthly average for cash buyers is 16.4 percent of all sales. Cash buyers paid a median $344,000 last month, down 4.4 percent month-to-month and up 37.6 percent from a year earlier.
In January, Southern California home buyers forked over a total of $3.22 billion of their own money in the form of down payments or cash purchases. That was down from a revised $4.34 billion in December and up from $2.89 billion a year ago. The out-of-pocket total peaked last May at $5.41 billion.
Credit conditions haven’t changed a lot in recent months but the change from a year earlier is significant.
Last month 13.5 percent of Southland home purchase loans were adjustable-rate mortgages (ARMs) – more than double the ARM rate of a year earlier and the highest since April 2008, when it was 16.4 percent. In December 13.0 percent of purchase loans were ARMs, while in January 2013 ARMs accounted for only 5.6 percent of the purchase loan market. Since 2000, a monthly average of about 31 percent of Southland purchase loans have been ARMs.
Jumbo loans, mortgages above the old conforming limit of $417,000, accounted for 26.7 percent of last month’s Southland purchase lending. That was down from 28.5 percent the prior month and up from 19.4 percent a year earlier. In the months leading up to the credit crunch that struck in August 2007, jumbos accounted for around 40 percent of the home loan market.
All lenders combined provided a total of $3.95 billion in mortgage money to Southern California home buyers in January, down from a revised $5.34 billion in December and up from $3.61 billion in January last year.
The most active lenders to Southern California home buyers last month were Wells Fargo with 7.0 percent of the total home purchase loan market, Bank of America with 2.8 percent and JP Morgan Chase with 2.5 percent.
Government-insured FHA loans, a popular low-down-payment choice among first-time buyers, accounted for 20.9 percent of all purchase mortgages last month. That was up from 19.6 percent the month before and down from 25.1 percent a year earlier. In recent months the FHA share has been the lowest since early 2008, mainly because of tighter FHA qualifying standards and the difficulties first-time buyers have competing with investors and cash buyers.
DataQuick monitors real estate activity nationwide and provides information to consumers, educational institutions, public agencies, lending institutions, title companies and industry analysts.
The typical monthly mortgage payment Southland buyers committed themselves to paying last month was $1,528, down from $1,594 the month before and up from $1,140 a year earlier. Adjusted for inflation, last month’s typical payment was 36.1 percent below the typical payment in the spring of 1989, the peak of the prior real estate cycle. It was 47.6 percent below the current cycle’s peak in July 2007.
Indicators of market distress continue to decline. Foreclosure activity remains well below year-ago and far below peak levels. Financing with multiple mortgages is very low, and down payment sizes are stable, DataQuick reported.